
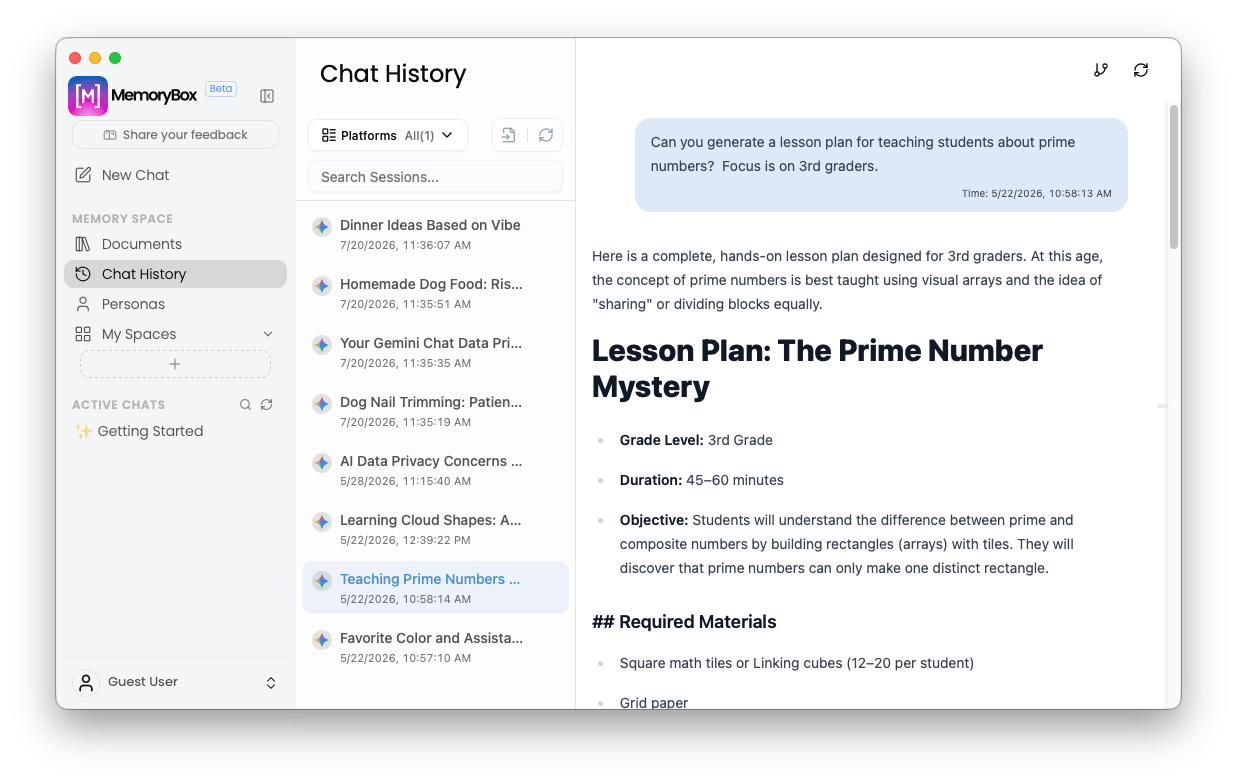
The central Chat History dashboard displaying platform filters, session timelines, and past generative outputs.
🖥️ Dashboard Architecture & Workflows
The interface uses a multi-column management console to track your historical interactions without cloud dependency:1. Searching and Filtering
- Cross-Platform Filtering: Use the Platforms dropdown toolbar selector to filter your historical ledger by specific AI engines or view your unified timeline all at once.
- Instant Session Search: Type keywords into the Search Sessions… input field to instantly parse historical conversation titles and find past topics.
2. Managing Your Timeline
- Chronological Tracking: Past threads (such as Learning Cloud Shapes or Teaching Prime Numbers) are displayed in a scrollable left-hand sub-pane complete with their exact generation dates and timestamps.
- Continuous Resyncing: Use the inline layout sync and refresh icons in the top right to instantly update your session ledger and pull down recent conversational data.
⚙️ Thread-Level Options & Target Actions
Hovering over any historical entry item within your scrollable timeline ledger surfaces an explicit Three-Dots Context Button (...). Clicking this button opens a localized context menu providing row-level utility configurations:
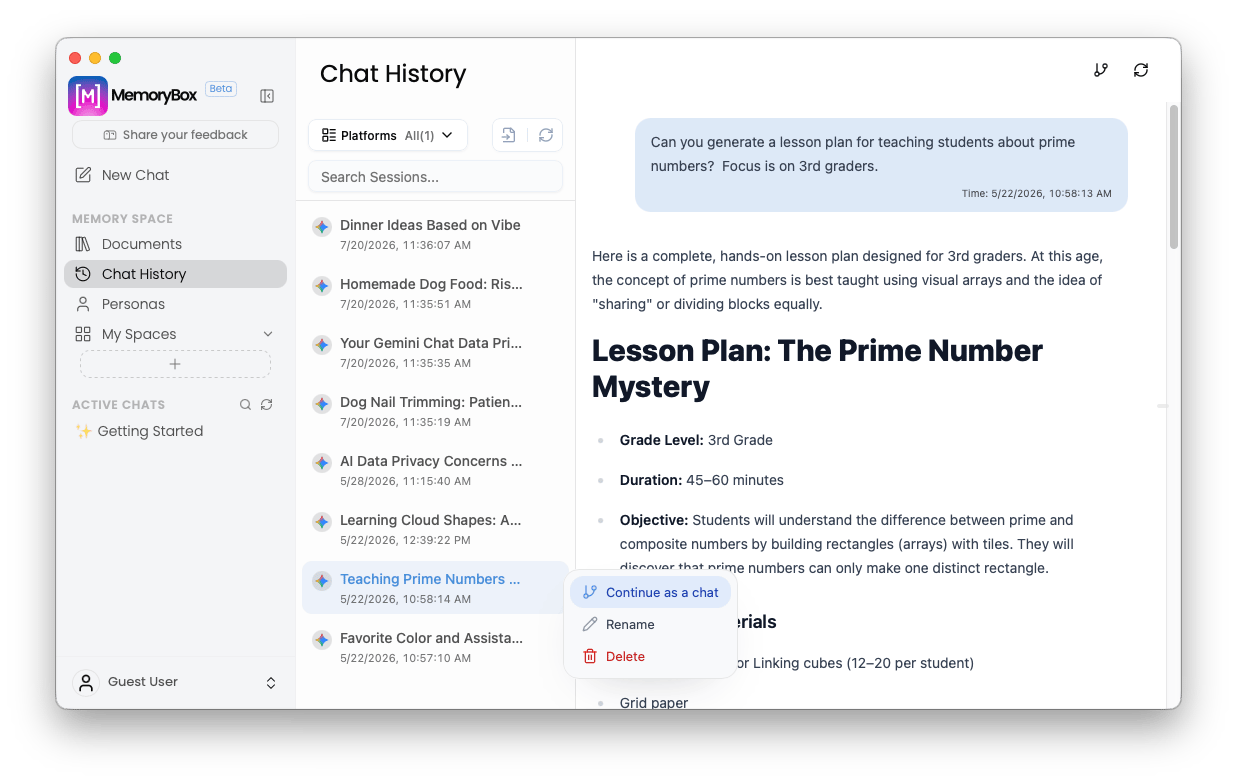
The row-level context menu options for individual historical chat nodes.
- Continue as a chat: Re-activates the historical stream, loading its saved context directly into the main workspace composer so you can seamlessly resume the live multi-turn dialogue loop.
- Rename: Highlights the title string metadata locally, allowing you to quickly rename the conversation thread reference without altering any historical log indices.
- Delete: Triggers an isolated deletion pipeline to drop the session tracking footprint completely from your local environment.
Safety Confirmation Dialog
To prevent unintended historical data removal, clicking Delete opens a structural workspace confirmation overlay modal: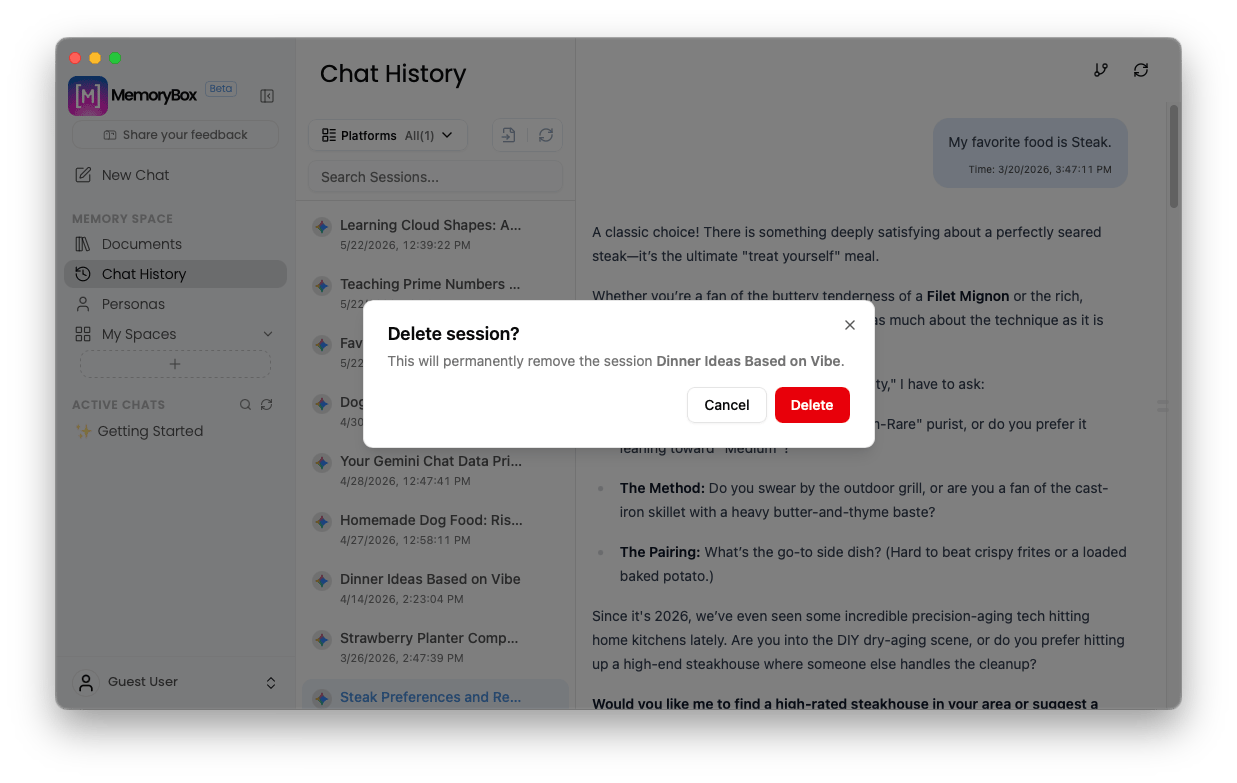
The verification warning alert modal guarding session deletion.
📥 Ingesting External Chats: The Import Data Console
If you want to bring historical conversations from other AI platforms into your local machine, click the import data button next to the platform filters. This opens a modal containing three targeted synchronization tracks: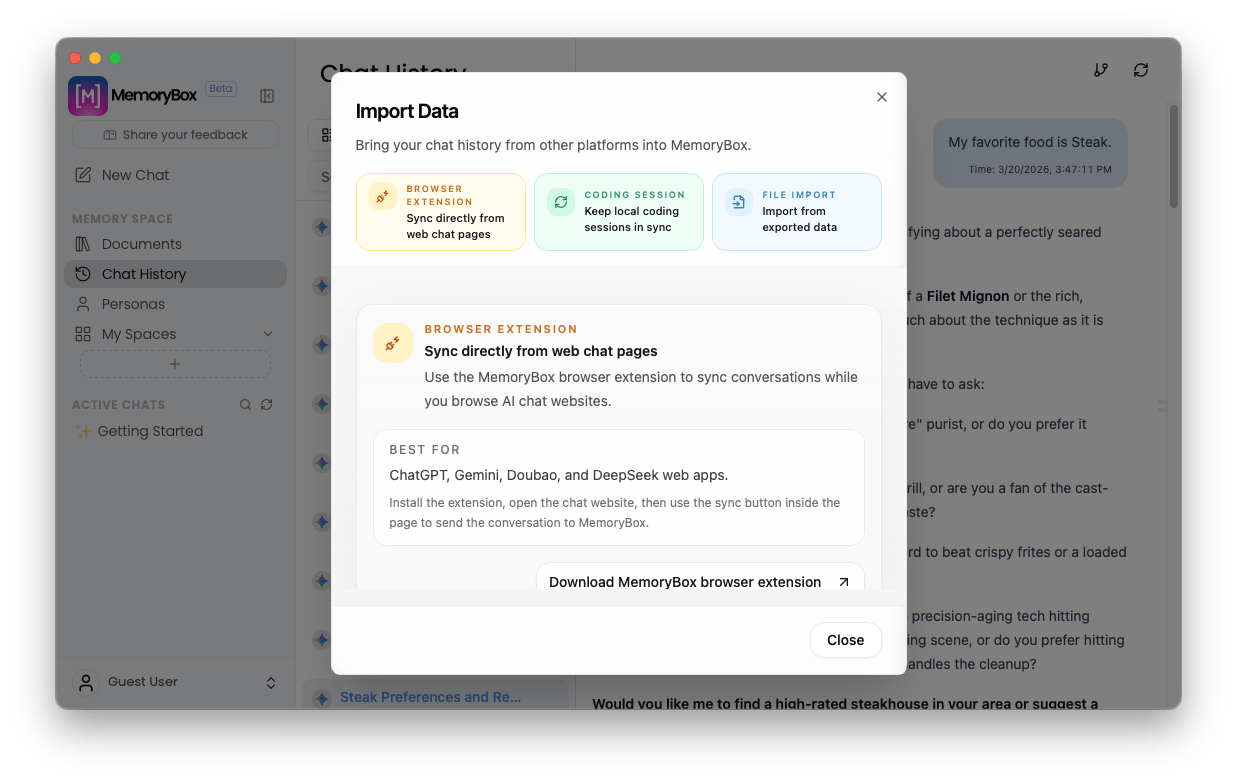
The unified Import Data utility window displaying the three historical ingestion tracks.
Track 1: Browser Extension (Automated Web Sync)
Designed for automated syncing while you browse web-based AI tools.- Supported Platforms: Optimized for ChatGPT, Gemini, Doubao, and DeepSeek web apps.
- Workflow: Install the extension, open your preferred AI web application, and click the inline sync button inside the web page to relay conversations directly down to your local desktop vault.
Track 2: Coding Session Sync
A specialized real-time background monitor tailored for developer workspaces.- Supported Engines: Features toggle selectors for Claude Code auto-sync and Codex auto-sync.
- Workflow: Flipping the Auto-sync toggle instructs MemoryBox to automatically watch your active developer coding environments, updating the sessions list continuously over time. You can check the Full sync checkbox to capture historical code logs.
Track 3: File Import (Manual Archive Package Parsing)
A manual backup pipeline designed to ingest static historical archive exports.- Supported Formats: Accepts platform-specific export packages (such as official ChatGPT export
.zipor.jsonarchives). - Workflow: Choose your target platform from the dropdown menu, locate your data export archive from your local filesystem, and click Import to parse the content.
🌐 The Extension Sync Process
When running a web sync via the browser extension companion, the system initializes an interactive synchronization module enabling granular queue tracking alongside background execution options:1. The Active Sync Manifest
The extension modal provides real-time validation states of your selected threads before and during the migration pipeline: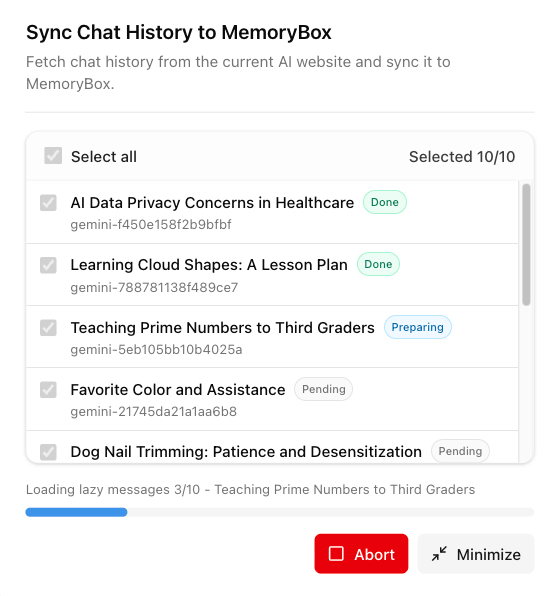
The active synchronization selection panel inside the browser extension with window management controls.
- Select all: A bulk master checkbox displaying an active selection counter (e.g.,
Selected 10/10). - Thread Identifiers: Thread titles mapped to explicit internal local reference hashes (e.g.,
gemini-f450e158...). - Live Status Chips: Visual trackers displaying processing phases, switching from Pending to Preparing, and turning green once fully marked as Done.
- Action Controls: Hit the red Abort button to cancel the queue immediately, or select the Minimize command button to clear the primary window viewport.
2. Minimized Background Execution Layout
Clicking Minimize cleanly reduces the data transmission display down into a non-intrusive floating control token component. This lets you monitor synchronization states out of your way while continuing your web work: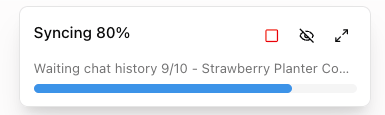
The minimized progress floating console tracking background conversation ingest workflows.
- Real-time Percentage: Displays a persistent digital tracking state (e.g.,
Syncing 80%) alongside an active progress tracking timeline rule. - Status Readout: Text strings cycle dynamically to show the active file target currently loading (e.g.,
Waiting chat history 9/10 - Strawberry Planter Co...). - Mini Action Orb Tray: Localized window controllers allow you to quickly Abort the transfer, completely Hide the tracker visually, or click the expansion arrow command tool to instantly restore the full manifest interface dashboard panel.
Next Step: Memory Space — Personas
Now that your historical logs are integrated, proceed to declare execution roles and configure your behavioral AI Expert Personas.